Area · DLD district Al Sabkha · 162nd by sales of 167
Al Sabkha
1 sales, Oct 2025–Sep 2026
Photo credit
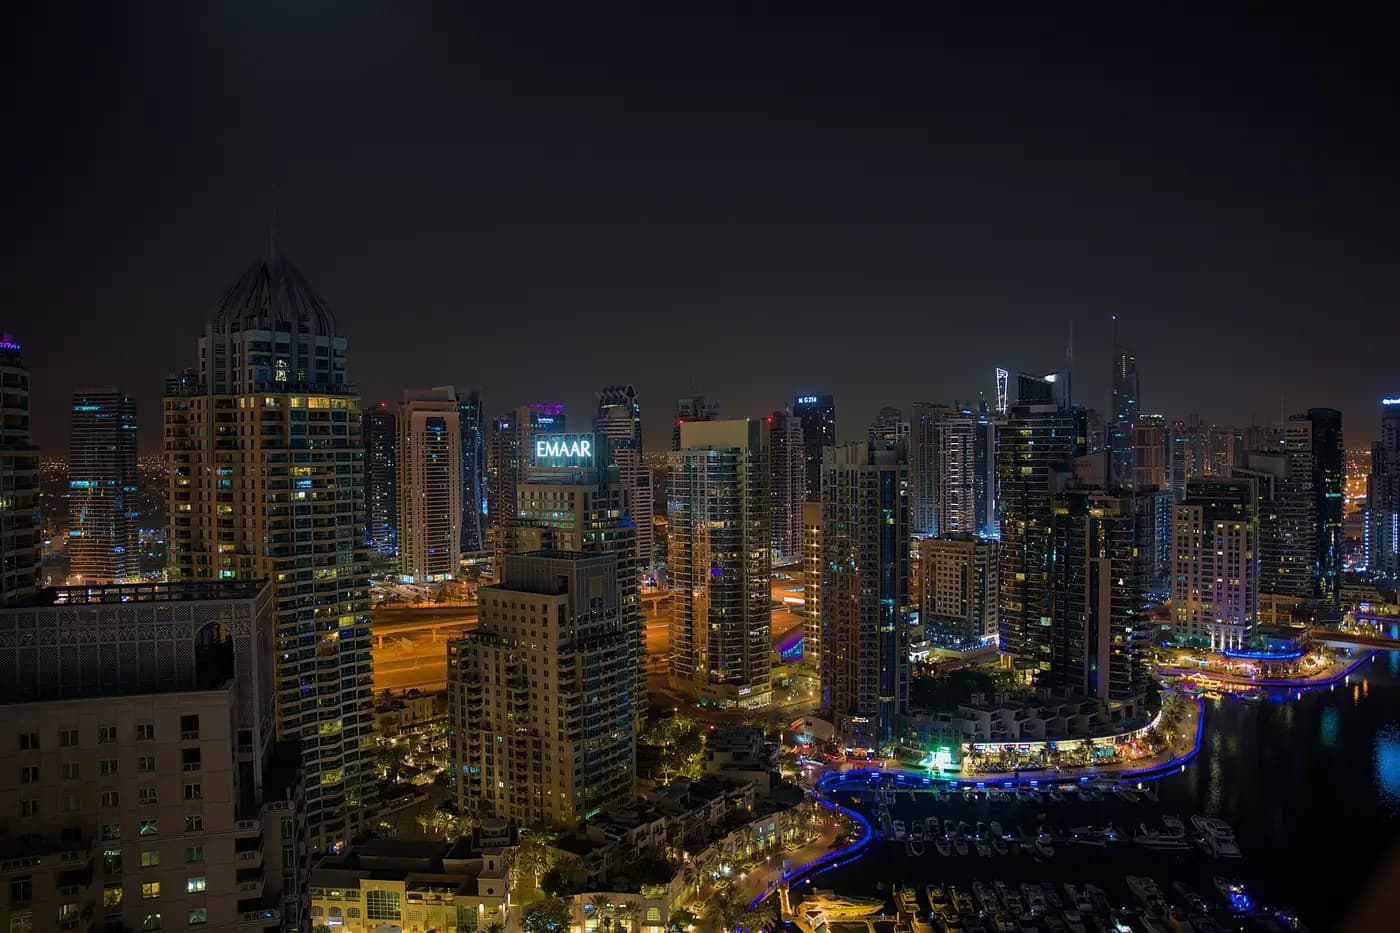
Dubai Marina towers at night, a general view of Dubai. Photo: Gfilip, Wikimedia Commons, CC BY-SA 4.0, resized and croppedMedian price per sq ft, homesSourceDLD registered salesWindowJul–Sep 2026Based on0 salesFiguremedian price per sq ft of flat and villa salesDatasales to 5 Oct 2026Fewer than 5 sales: no median shownHow it is worked out
—
fewer than 5 home sales, Jul–Sep 2026
Sales, 12 monthsSourceDLD registered salesWindowOct 2025–Sep 2026Based on1 saleFigureregistered sales of every property typeDatasales to 5 Oct 2026How it is worked out
1
−50% on Oct 2024–Sep 2025
Projects with a registered sale
0
DLD register: 0 active in Al Sabkha
Off-plan share
0%
of the sales over Oct 2025–Sep 2026
Al Sabkha in short
- Al Sabkha registered 1 sale over Oct 2025–Sep 2026, 50% fewer than the year before, and 0% were off-plan.
Al Sabkha market insights
Registered with DLD under the district Al Sabkha, 2020 to 5 Oct 2026.
Each point is the median price per square foot of the month’s registered home sales (flats and villas). A month with fewer than 10 home sales is left as a gap. Registered prices, not asking prices.
Sales a year
Full years only, registered sales of every type. 1 sales in 2026 to 5 Oct.
Off-plan share
0% of the 1 sales over Oct 2025–Sep 2026 were registered as off-plan, DLD’s own registration type.
The full record
every figure behind the summaryAl Sabkha year by year
| Year | Sales | Value | Off-plan | Home sales | Median home AED /sq ft |
|---|---|---|---|---|---|
| 2020 | 1 | AED 2.2m | 0 | 0 | — |
| 2021 | 1 | AED 5.0m | 0 | 0 | — |
| 2022 | 1 | AED 1.1m | 0 | 0 | — |
| 2023 | 1 | AED 17.5m | 0 | 0 | — |
| 2024 | 3 | AED 4.1m | 0 | 0 | — |
| 2026 to 5 Oct | 1 | AED 70.0m | 0 | 0 | — |
Sales and value: registered sales of every property type. The median covers home sales only.
Land, whole buildings and other units
Plots, whole buildings, offices, shops and hotel units price on other terms, so they are left out of every median on this page. They are counted in its sales and value.
| Year | Land plots | Value | Whole buildings | Value | Offices, shops, hotel units | Value |
|---|---|---|---|---|---|---|
| 2020 | 0 | — | 1 | AED 2.2m | 0 | — |
| 2021 | 0 | — | 1 | AED 5.0m | 0 | — |
| 2022 | 0 | — | 1 | AED 1.1m | 0 | — |
| 2023 | 0 | — | 1 | AED 17.5m | 0 | — |
| 2024 | 0 | — | 3 | AED 4.1m | 0 | — |
| 2026 to 5 Oct | 0 | — | 1 | AED 70.0m | 0 | — |
Latest registered sales in Al Sabkha
| Date | Project or building | Type | Price | AED /sq ft |
|---|---|---|---|---|
| 4 Feb 2026 | —Ready | Building | AED 70.0m | — |
| 18 Dec 2024 | —Ready | Building | AED 3.5m | — |
| 25 Nov 2024 | —Ready | Building | AED 119k | — |
| 1 Aug 2024 | —Ready | Building | AED 508k | — |
| 13 Dec 2023 | —Ready | Building | AED 17.5m | — |
| 19 Dec 2022 | —Ready | Building | AED 1.1m | — |
| 19 Apr 2021 | —Ready | Building | AED 5.0m | — |
| 10 Nov 2020 | —Ready | Building | AED 2.2m | — |
Every type of sale, newest first, to 5 Oct 2026. Price per sq ft for homes only.
Before you buy in Al Sabkha
Want help buying or selling in Al Sabkha? Ask for a broker introduction. Only if you want one.
About Al Sabkha
DLD registers sales here under the district Al Sabkha. 1 sale of every type was registered over Oct 2025–Sep 2026.
It is the 162nd by registered sales of the 167 Dubai districts with a sale over Oct 2025–Sep 2026.
In 2020 the district registered 1 sale; in 2024, 3.
0% of the sales over Oct 2025–Sep 2026 were off-plan, by DLD’s own registration type.
Questions about Al Sabkha
How much does property cost in Al Sabkha?
These are registered prices from the Dubai Land Department, not asking prices.
How many properties sold in Al Sabkha last year?
1 sale of every type was registered over Oct 2025–Sep 2026.
Cite this page
Al Sabkha, Dubai. Real Estate IQ, from DLD registered sales to 5 Oct 2026. dubairealestateiq.com/area/al-sabkha
Sources: Dubai Land Department open data, registered sales to 5 Oct 2026, via Dubai Real Estate Data (CC BY 4.0), processed by Real Estate IQ; DLD project register, read 13 Oct 2026. Registered prices, not asking prices or valuations. How the figures are worked out.
Read next
 GuideHow to check a Dubai off-plan project’s completion dateGuideAsking price or registered price: how to check a quote
 TrackerActive projects on the DLD register, with their completion dates
Photos: Towers under construction, Dubai by Leandro Neumann Ciuffo (Wikimedia Commons, CC BY 2.0); Dubai Marina at night by Gfilip (Wikimedia Commons, CC BY-SA 4.0); Dubai skyline at dusk by imran shahabuddin (Wikimedia Commons, CC BY 2.0). Resized and cropped.